- Home
- School Information
- Results
Results

KS2 Data
KS2 Progress 2024
There are no progress measures for 2023/2024 due to no KS1 data for this cohort because of Covid -19 disruption.
|
KS2 Attainment |
2023/2024 |
|
|
Subject |
Expected Standard |
Greater Depth |
|
Reading |
59% |
6% |
|
Writing |
63% |
9% |
|
Maths |
53% |
6% |
|
R,W,M |
44% |
0 |
|
KS2 Averaged Scaled Score per pupil |
2023/2024 |
|
Reading |
102 |
|
Maths |
100 |
Key stage 4
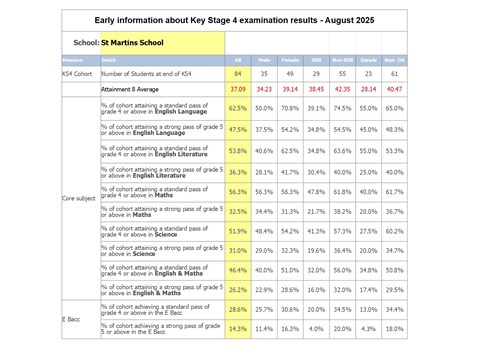
| Early information about Key Stage 4 examination results - August 2025 | ||||||||
| School: | St Martins School | |||||||
| Measure | Detail | All | Male | Female | SEN | Non SEN | Disadv | Non- DA |
| KS4 Cohort | Number of Students at end of KS4 | 84 | 35 | 49 | 29 | 55 | 23 | 61 |
| Attainment 8 Average | 37.09 | 34.23 | 39.14 | 38.45 | 42.35 | 28.14 | 40.47 | |
| Core subject | % of cohort attaining a standard pass of grade 4 or above in English Language | 62.5% | 50.0% | 70.8% | 39.1% | 74.5% | 55.0% | 65.0% |
| % of cohort attaining a strong pass of grade 5 or above in English Language | 47.5% | 37.5% | 54.2% | 34.8% | 54.5% | 45.0% | 48.3% | |
| % of cohort attaining a standard pass of grade 4 or above in English Literature | 53.8% | 40.6% | 62.5% | 34.8% | 63.6% | 55.0% | 53.3% | |
| % of cohort attaining a strong pass of grade 5 or above in English Literature |
36.3% | 28.1% | 41.7% | 30.4% | 40.0% | 25.0% | 40.0% | |
| % of cohort attaining a standard pass of grade 4 or above in Maths | 56.3% | 56.3% | 56.3% | 47.8% | 61.8% | 40.0% | 61.7% | |
| % of cohort attaining a strong pass of grade 5 or above in Maths | 32.5% | 34.4% | 31.3% | 21.7% | 38.2% | 20.0% | 36.7% | |
| % of cohort attaining a standard pass of grade 4 or above in Science | 51.9% | 48.4% | 54.2% | 41.3% | 57.3% | 27.5% | 60.2% | |
| % of cohort attaining a strong pass of grade 5 or above in Science | 31.0% | 29.0% | 32.3% | 19.6% | 36.4% | 20.0% | 34.7% | |
| % of cohort attaining a standard pass of grade 4 or above in English & Maths | 46.4% | 40.0% | 51.0% | 32.0% | 56.0% | 34.8% | 50.8% | |
| % of cohort attaining a strong pass of grade 5 or above in English & Maths | 26.2% | 22.9% | 28.6% | 16.0% | 32.0% | 17.4% | 29.5% | |
| E Bacc | % of cohort achieving a standard pass of grade 4 or above in the E Bacc | 28.6% | 25.7% | 30.6% | 20.0% | 34.5% | 13.0% | 34.4% |
| % of cohort achieving a strong pass of grade 5 or above in the E Bacc | 14.3% | 11.4% | 16.3% | 4.0% | 20.0% | 4.3% | 18.0% | |

To view performance tables for St Martins, click here.
To view performance tables for other schools, click here.

